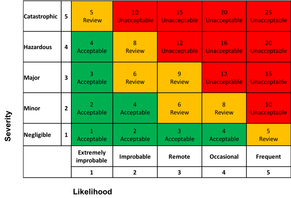
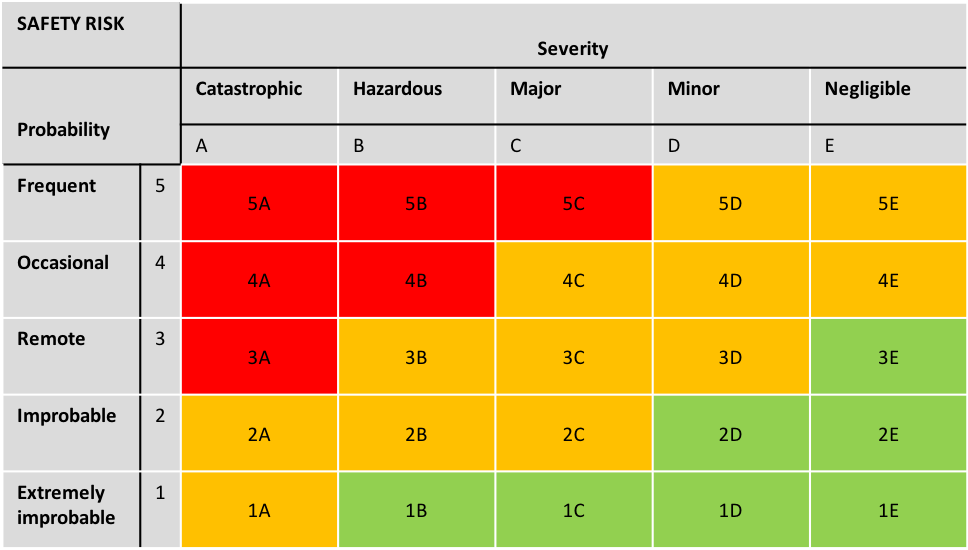
 CAA UK’s CAP 795, Safety Example Risk Matrix from Management Systems (SMS) guidance for organisations Table 1 CAA UK’s CAP 795, Safety Example Risk Matrix from Management Systems (SMS) guidance for organisations Table 1 I was asked the other day what advantage a 5x5 risk matrix has over a 4x5 and it started me thinking. A risk matrix is meant to help categorise, prioritise and compare risks, so what difference do 5 or 4 rows or columns really make? I assumed it would depend on how precisely the severity and likelihood ranges had been defined but what I found out was so much more. I have always been mildly sceptical of risk matrices, struggling to see how all that risk data can be condensed and simplified into a single box, and still remain meaningful. I was delighted to find my scepticism was well placed! My research highlighted that there is no scientific method of designing the scale used in a risk matrix. From the numerous and varied scales I have encountered in aviation and elsewhere, the common factor is they are typically ordinal scales. An ordinal scale has no fixed distance between the levels; the numbers represent a rank position. Questions with subjective responses are often ordinal, for example, “how much pain are you in?” could be answered with “none”, “a little”, “some”, “a lot”, “excruciating”. The responses go from least to most pain, but it’s not clear whether the difference between “none” and “a little” is bigger, smaller, or the same as the difference between “a lot” and “excruciating”. This also emphasises the subjective nature of the scale. What’s excruciating to me maybe merely “a little painful” to you. Ordinal responses may be transformed in any way that preserves their order, which in a 5x5 risk matrix could be 1-5 or even 0,5,37,40 and 103. The numbers are irrelevant as long as the order stays the same. Using the previous example, we cannot say that “excruciating” is twice as painful as “some”. Similarly, 70 degrees is not twice as hot as 35 degrees, because multiplication cannot be applied to an ordinal scale. However, this is what appears to have been done in the CAA UK’s CAP 795, Safety Management Systems (SMS) guidance for organisations (Table 1). The numbers are imply certain comparisons between risks, suggesting that Remote/hazardous is twice as risky as improbable/major; the result of committing the mathematical no-no of multiplying an ordinal scale. Cox (2008) has written extensively about risk matrices and investigates how the use of ordinal scales can lead to errors in decision making. His term “range compression” may cause risks with significantly different quantitative values to be placed in the same cell. Consider ICAO’s “Example safety risk severity table” (table 2). The boundary between hazardous and catastrophic is blurred because there is nowhere to categorise a single, or even a “few” deaths. Using this scale, a risk resulting in one or two deaths would have to be categorised alongside total hull loss, mass casualties, and all-round mayhem, which feels wrong to me.
Thomas, Reidar and Bratvold talk about centring bias, a phenomenon in which 75% of the probability ratings assessed were centred around 2,3 and 4, thereby effectively reducing the matrix to a 3x3! Also, probability ratings are often necessarily ambiguous and open to interpretation. A study by Budescu et al (2009) showed that “very likely” was assigned to probabilities varying from 0.43 to 0.99; context and personal attitude to risk will always influence a person’s perception of consequence. Additionally, the words used to describe probability (compare these two definitions of improbable: “virtually improbable and unrealistic” with “ would require a rare combination of factors to cause an incident”) lead to inconsistencies.
Before summing up, I give you an interesting extract from Cox’s paper: “..the common assumption that risk matrices, although imprecise, do some good in helping to focus attention on the most serious problems and in screening out less serious problems is not necessarily justified. Although risk matrices can indeed be very useful if probability and consequence values are positively correlated, they can be worse than useless when probability and consequence values are negatively correlated. Unfortunately, negative correlation may be common in practice, for example, when the risks of concern include a mix of low-probability, high consequence and higher-probability, low-consequence events”. So what’s the alternative, given that risk matrices are so entrenched in our risk management practices? First, we need to recognise the limitations of risk matrices and educate ourselves so we are in a position to explain why they do not necessarily support good risk management decisions and by association, the effective allocation of resources. Secondly, time spent pondering whether the probability of something is 3 or 4 should instead be invested in mapping out possible accident scenarios, in identifying the critical controls and ensuring they are adequate and reliable. We can then assign priorities to barriers and assess whether the effectiveness of the barrier is tolerable, rather than prioritising and categorising a set of risks based on a flawed matrix. Ball, D.J. and Watt, J. (2013) Further thoughts on the utility of risk matrices. Risk Analysis. Vol 33, 11. Budescu, D.V., Broomell, S., and Por, H.H. (2009). Improving communication of uncertainty in reports of the intergovernmental panel on climate change. Psychological Science. 20, 3:299-308. Cox Jr., L.A. (2008). What’s wrong with Risk Matrices? Risk Analysis. Vol 28, 2. Hubbard, D. W., Seiersen, R. (2016) How to Measure Anything in Cybersecurity Risk.Wiley:New Jersey ICAO Doc 9859 Safety Management Manual(2018) Fourth edition Safety and Airspace Regulation Group. (2015). CAP 795 Safety Management Systems (SMS) guidance for organisations. CAA UK. Thomas, P. Bratvold, R.B. and Bickel, J.E. (2013) The Risk of Using Risk Matrices. SPE Economics and Management.
3 Comments
|
Emily HarbottleFounder of HarbottleHughes. Enjoys reading the views of Kahneman, Dekker and Muller. ArchivesCategories |

 RSS Feed